
This vector layer displays values of selected observation property of features at the feature or observation location. The location of the shown geometry depends on the spatial data support of the feature type. The displayed observations are always shown as point (midpoint of the actual geometry). The layer can be configured in a way that color and/or size of the displayed point is chosen automatically based on the value of the observation property.
This layer type can bind any number of features, it will use the data filter of the map view definition to filter the observations shown on the map. The layer also supports aggregation to display observation properties out of level-1 collections.
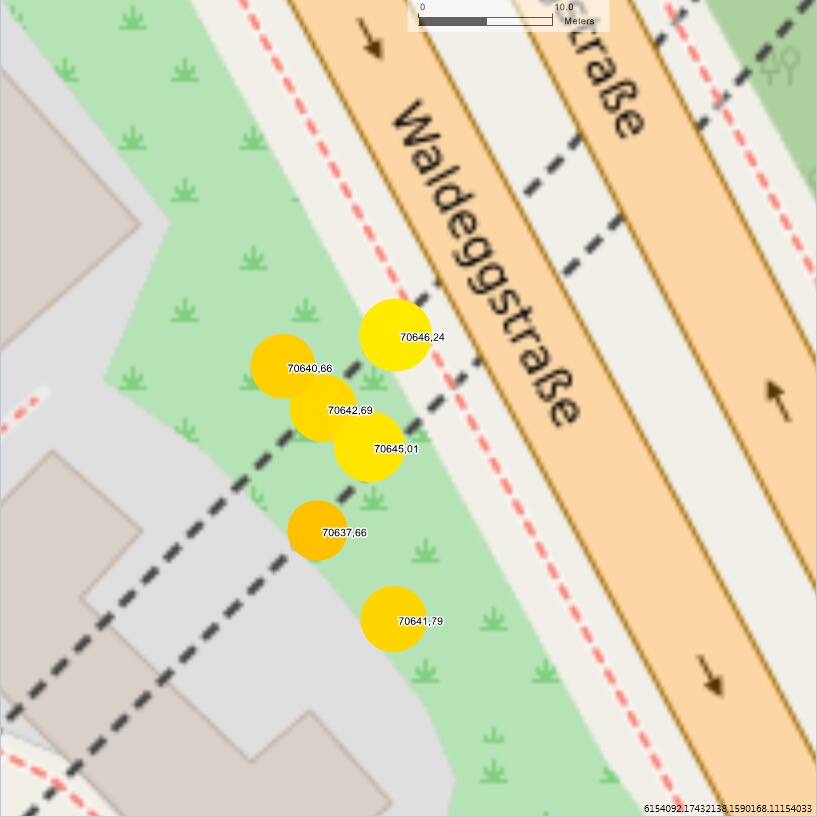
Figure 1: Example of a map view using an Observation property - Midpoint layer
Transforming observation values into point sizes and colors
Setting |
Description |
Expand container features |
If this option is set bound container features are expanded and the contents of the container feature are shown (instead of the bound feature) |
Max. observations per feature |
Defines an upper limit of observations shown for each feature. If a feature has more observations than this number only the first observations will be shown. |
Transversal offset |
Transversal offset is an offset value to be applied to features or observations located with axis. |
Feature Type |
Fixes and limits the feature type for the layer. Once set only features of that feature type can be bound to the layer |
Observation property |
When the feature type is fixed, this displays the possible available properties that will be used as observation property value. Note: this configuration appears when a feature type is selected. |
Collection aggregation |
Defines how collection properties are handled. Default is First value. Options are: •First value •Last value •Sum •Average •Minimum value •Maximum value Note: this configuration appears when a feature type is selected. |
Aggregation classification filter |
If set only those properties will be used. For collection properties this sets a filter: only those properties inside a collection shall be used, where a value of another classification property inside this collection equals given value. Note: this configuration appears when a feature type is selected. |
Observation status |
A point of time for observations to get the closest observations from the supplied date time. When set system will try to get the nearest observation to that point of time. Default is null. If null system retrieves the latest observation. |
Scaled point display type |
Allows user to select the display type. Options are •Scaled point •Scaled point with color ramp Scaled point: Scaled point is the simplest presentation of the data, which based on the negative and positive color selected, draws the geometry based on whether the values are positive and negative. Scaled point with color ramp: Uses a superior logic to compute the the color from a color ramp using the value, positive and negative color and expected value ranges(min and max). |
Use logarithmic scaling |
Default is false. When set to true both the color and size of the geometries are computed using uses logarithmic scaling. |
Minimum expected value |
Minimum expected value, minimum expected value allows user to define the minimum expected value of the selected property. This value is used for computing the the geometry size and color. Default: -1000 |
Maximum expected value |
Maximum expected value, maximum expected value allows user to define the maximum expected value of the selected property. This value is used for computing the the geometry size and color. Default: 1000 |
Minimum point size |
Minimum point size, used for computing thickness for geometries, used to compute the thickness of the geometry using the observation property value. |
Maximum point size |
Maximum point size, used for computing thickness for geometries, used to compute the thickness of the geometry using the observation property value. |
Negative value color |
Negative value color, the color to use when the values are negative or in the bottom range of the minimum expected value. Note: How colors are computed depend on the setting "Scaled point display type" above |
Positive value color |
Positive value color, the color to use when the values are positive or in the upper range of the maximum expected value. Note: How colors are computed depend on the setting "Scaled point display type" above |
Decimal places |
Decimal places to display when showing numeric values as text display. |
Feature name display |
Allows user to select how and what information of the features or observation value shall be shown along with the geometry. User has the following options: •None: Shows no label, only geometries •Property value: Shows the value of the selected property using the "Decimal places" setting. •Text template: Allows user to take advantage of the text templates to customize the labels according to theirs needs. |
Table 1: Available configuration settings for this layer type
