
This vector layer displays a selected observation property values of features in the feature or observation location. The location of the shown geometry depends on the spatial data setting of the feature or observation location. The geometries are always shown as defined in the feature or observation spatial data(Point, Line, Polygon).
This layer type can bind any number of features. This layer type will use the data filter of the map view definition to filter the observations shown on the map. The layer also allows to use basic set aggregation functions to be used for observation property collection which are described below.
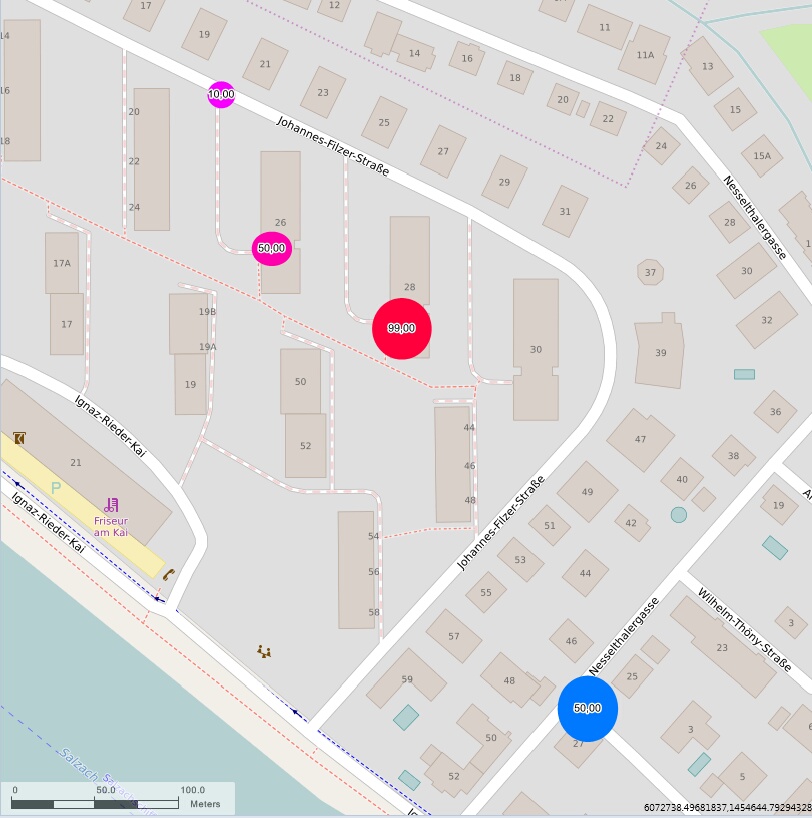
The layer allows to easily visualize an observation property values on a map, an example could be seen in the following example which illustrates the observation property value e.g. X of one feature. With additional settings the property values are used to compute the color and the size of geometry and drawn in the corresponding location.
Setting |
Description |
Defines zoom extents |
If selected the contents of this layer and all other layers with this flag set will be used to calculate the boundary for zoom extents. |
Hide contents |
If selected the layer's contents will not be shown. However the layer's contents can still be used to define zoom extents. |
Report layer |
Defines that the layer is used as a report layer. If the map view is used in a report that loops through features the features in this layer will be automatically exchanged. |
Feature limit |
The maximum number of features that will be drawn. Even if more features are connected, the map will never show more features than defined by this setting. Displaying many features on a map view might take a long time for getting and rendering the data. This setting should avoid long rendering time if you accidentally connect a huge number of feature (e.g. by connecting a view) |
Opacity |
A value between 1 and 255 that defines the opacity of the visual elements shown in this layer. 1 = nearly transparent, 255 is opaque. |
Expand container features |
If this option is set bound container features are expanded and the contents of the container feature are shown. |
Max. observations per feature |
Defines an upper limit of observations shown for each feature. If a feature has more observations than this number only the first observations will be shown. |
Transversal offset |
Transversal offset is an offset value to be applied to features or observations located with axis. |
Feature Type |
Fixes and limits the feature type for the layer. Once set only features of that feature type can be bound to the layer |
Observation property |
When the feature type is fixed, this displays the possible available properties that will be used as observation property value. Note: this configuration appears when a feature type is selected. |
Collection aggregation |
Defines how collection properties are handled. Default is First value. Options are: •First value •Last value •Sum •Average •Minimum value •Maximum value Note: this configuration appears when a feature type is selected. |
Aggregation classification filter |
If set only those properties will be used. For collection properties this sets a filter: only those properties inside a collection shall be used, where a value of another classification property inside this collection equals given value. Note: this configuration appears when a feature type is selected. |
Observation status |
A point of time for observations to get the closest observations from the supplied date time. When set system will try to get the nearest observation to that point of time. Default is null. If null system retrieves the latest observation. |
Use logarithmic scaling |
Default is false. When set to true both the color and size of the geometries are computed using uses logarithmic scaling. |
Minimum expected value |
Minimum expected value, minimum expected value allows user to define the minimum expected value of the selected property. This value is used for computing the the geometry size and color. Default: -1000 |
Maximum expected value |
Maximum expected value, maximum expected value allows user to define the maximum expected value of the selected property. This value is used for computing the the geometry size and color. Default: 1000 |
Minimum outline thickness |
Minimum outline thickness for geometries, used to compute the thickness of the geometry using the observation property value. |
Maximum outline thickness |
Maximum outline thickness for geometries, used to compute the thickness of the geometry using the observation property value. |
Minimum value color |
Minimum value color, the color to use when the values are in the bottom range of the minimum expected value. Note: How colors are computed depend on the setting "Scaled point display type" above |
Maximum value color |
Maximum value color, the color to use when the values are in the upper range of the maximum expected value. Note: How colors are computed depend on the setting "Scaled point display type" above |
Decimal places |
Decimal places to display when showing numeric values as text display. |
Feature name display |
Allows user to select how and what information of the features or observation value shall be shown along with the geometry. User has the following options: •None: Shows no label, only geometries •Property value: Shows the value of the selected property using the "Decimal places" setting. •Text template: Allows user to take advantage of the text templates to customize the labels according to theirs needs. |
