
The chart window is a document window used for creating a chart definition and executing the definition i.e. displaying the chart. This window is used for charts of type time value, cross, and axis.
The window can be opened from the Ribbon' Presentation tab by selecting Time chart, Axis chart or Cross chart, or from the Data Domain Explorer window by selecting a chart template and then selecting Create presentation from the context menu.
The Chart tab shows several different areas. The Data source area area (figure 1:1) that is further divided into the Data source pins (figure 1:2) and the Features on selected pins (figure 1:3) area is used for defining the data binding of the chart. The Data source area can be collapsed (figure 1:4) to have more space for the chart itself (figure 1:7).
The Settings area to the right of the window (figure 5) shows a property grid that is used for specifying the settings for the whole chart for the currently selected pin in the Data source pins area or for the currently selected selected feature in the Features on selected pin area. The Settings area can be collapsed (figure 1:6) to have more space for the chart itself.
The central area of the window (figure 1:7) is used for displaying the rendered chart.

Figure 1: The Chart tab of the chart window (here opened for a time chart)
To specify settings for the whole chart choose Show chart settings from the window's toolbar. The available chart settings will then be shown in the property grid in the Settings area. Which settings are available depends on the specific chart type the window was opened for.
In the Data source area you define what data shall be displayed in the chart. To display the observations of a feature in a chart you first have to define a pin.
If you open the chart window from the Ribbon (and not form a presentation template or presentation template binding one data source pin with will be already created and will be shown in the Data source pins area. To create a new pin select Create pin from the window's toolbar. Note that the chart type might restrict the number of pins you can create. You can rename a pin by selecting the pin and then pressing F2 or by selecting Rename from the context menu.
Before you can link features to a pin you will first have to type the pin. This is done by selecting the pin and then choosing the feature type in the property grid in the Settings area. As soon as a pin is typed you can drag feature of that type into the Features on selected pin area to link features to the currently selected pin. Only features of the selected type can be linked to a pin. To remove feature from the list of features that are linked to a pin, select the pin, then select the feature you want to remove in the Features on selected pin area, and then either hit the [Del] key or choose Delete from the context menu.
The settings for a specific feature linked to a pin a re shown in the property grid of the Settings area when the feature is selected in the Features on selected pin area.
As soon as all required settings were taken you can execute the chart definition by selecting Execute from the window's toolbar. If any settings are missing or invalid this will be reported in the output window.
The Filter tab allows to specify a time filter that will can be applied to all data presented with the chart, i.e. if the time filter is applied only observations with a sampling timestamp that matches the filter will be shown in the chart.
Select Apply time filter to enable time filtering for the chart. If this checkbox is not selected the time filter (even if configured) will not be applied. You can select between a static time span or dynamic time span for filtering by selecting the appropriate value from the Filter type list box, this will then show the control block for either the static or dynamic time span.
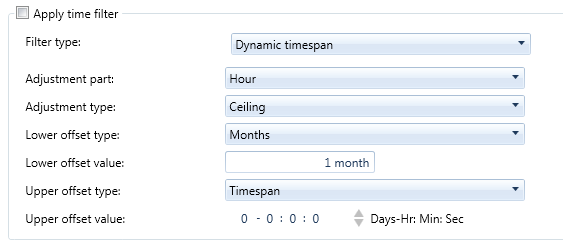
Figure 2: The Filter tab of the chart window, showing the control the dynamic time span control block
Saving as template
The chart definition created in this window can be saved as a presentation template and/or as a presentation template binding. Selecting Save from the window's toolbar will open the window modal dialogue for saving (figure 3).
If you want opened the window from a presentation template or a presentation template binding the controls in this dialogue will be already filled. If the chart was not opened from a presentation template or a presentation template binding the controls will be empty.
To save the current chart definition as presentation template type a name and optionally a description in the Save template group box. The Private checkbox defines if the template will only visible to you or will be generally visible to all users. Select a domain in which the template shall be stored by dragging a domain from the Data Domain Explorer to the Domain drop. Select Save to store the template. Note that if the chart definition was opened from an existing template the template will be overwritten. If not the template will be created. Select Save copy if the chart definition was opened from a template but you wan to store it as a new template.
To save the current bindings as presentation template binding you will have to save the template first. Type a name and optionally a description in the Save bindings group box. The Private checkbox defines if the template and data binding will only visible to you or will be generally visible to all users, the private checkbox is only effective if the template the binding is saved for is not private.
Note that if the chart definition was opened from an existing presentation template binding the template binding will be overwritten. If not the template will be created. Select Save copy if the chart definition was opened from a presentation template binding but you want to store it as a new presentation template binding.
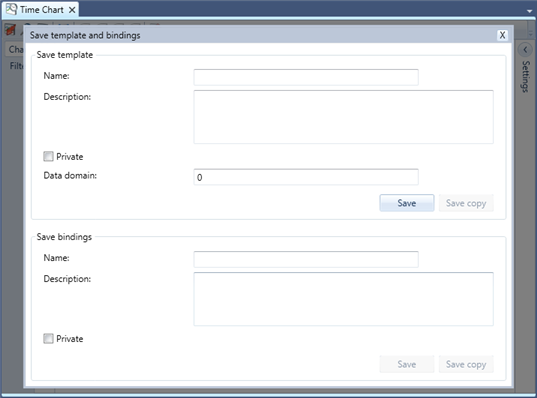
Figure 3: The Save template and bindings window modal dialogue
