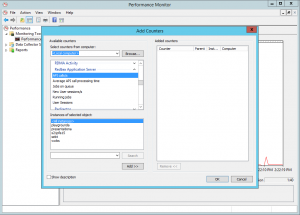
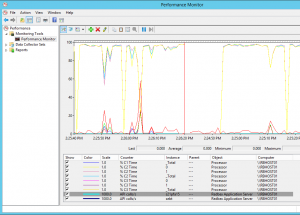
The Windows Performance Monitor is part of every currently available Windows Operating System. It is is available as a Microsoft Management Console (MMC) snap-in that provides tools for analyzing system performance. From a single console, you can monitor application and hardware performance in real time, customize what data you want to collect in logs, define thresholds for alerts and automatic actions, generate reports, and view past performance data in a variety of ways. It can be used to examine how programs you run affect your computer’s performance, both in real time and by collecting log data for later analysis. The Redbex Application Server supports the Windows Performance Monitor; it forwards some performance relevant information to the Windows Performance Monitor so that you can monitor the load and performance of your server system, identify hardware and software bottlenecks and optimize your installation scenario.
During installation the Redbex Application Server registers so called performance counters with the the Windows Performance Monitor. Performance counters are measurements of system state or activity. The Windows operating system as well as other applications you might have installed on your server provide their own performance counters. Please see the Redbex Reference Manual for a listing of all performance counters registered by the Application Server install program.
Real time charts are one of the possibilities that the Windows Performance Monitor provides to monitor your server. You can use the charts to compare different performance counters easily. Logging, alerting and reporting are even more sophisticated tools the Performance Monitor provides and are of big help especially in enterprise environments.
For detailed information about all the possibilities the Windows Performance Monitor provides I recommend to read this chapter on TechNet.

