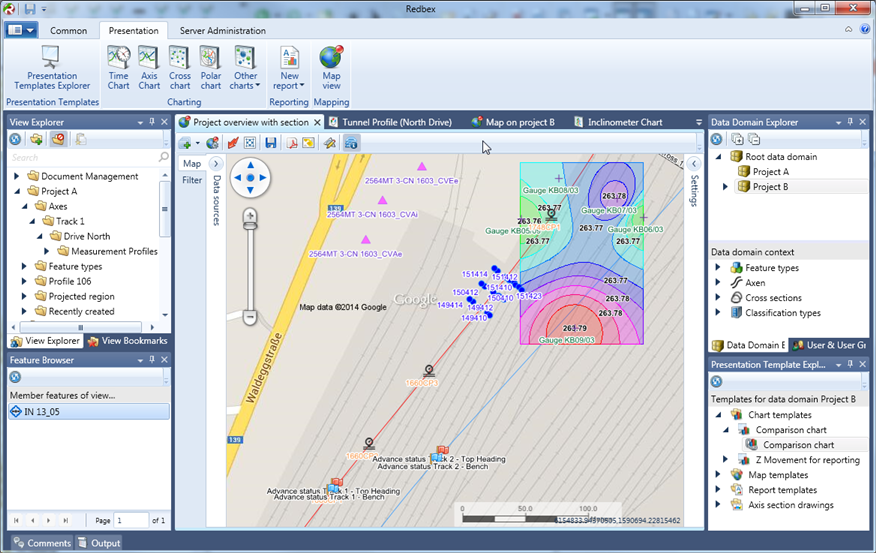
Most data you receive from sensors will map to some real world location. Maps are therefore obviously a good way to present sensor data and get a quick overview on your projects. Redbex includes a mighty GIS engine that allows you to visualize data in many different ways.
All data stored in Redbex can be easily visualized on a map. Maps are highly configurable and can be adjusted to your specific needs. Maps visualize data using the stored spatial data on an abstraction of the Earth’s surface. Redbex is able to transform data from different spatial reference systems.
Redbex supports nearly any geographic or projected coordinate system. Using proj4 notation you can easily define your own custom projected coordinate system. Redbex automatically converts feature location between coordinate systems when rendering maps, even data located using axis reference systems can be placed on the map.
Redbex supports Google, Bing or OpenStreet maps as Background layer (Note that additional costs may apply).
Redbex can render data from WMS and WFS. This way it is easy to connect Redbex to your existing GIS systems or integrate with services from other companies.
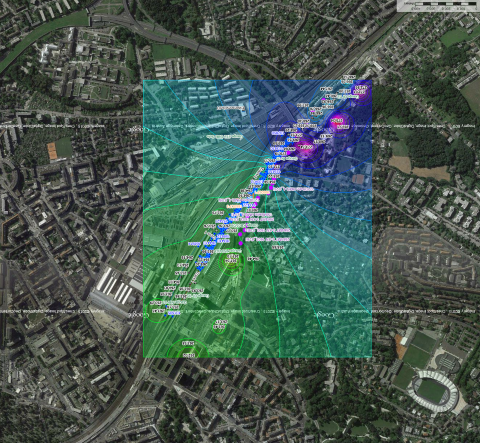
Data can be presented as contour lines – an easy way to interpolate and visualize data spatially.
Redbex Maps are interactive, you can query or draw data spatially select and modify data directly on a map.
Maps can be integrated in reports. When a map template is saved then can be used in report. The reporting features location map with configured layers will be drawn in the report.
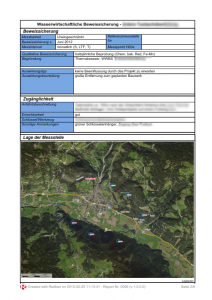
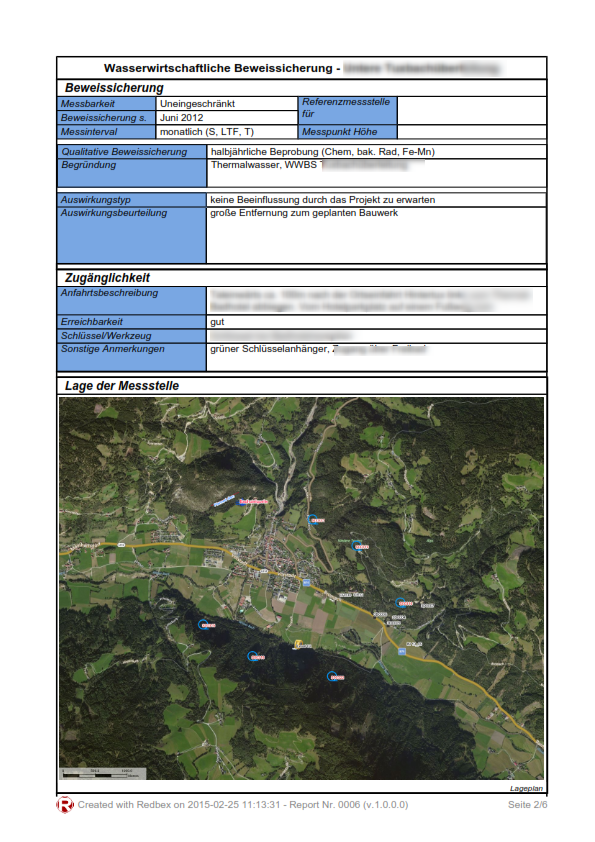
Reporting example: Report with data and map

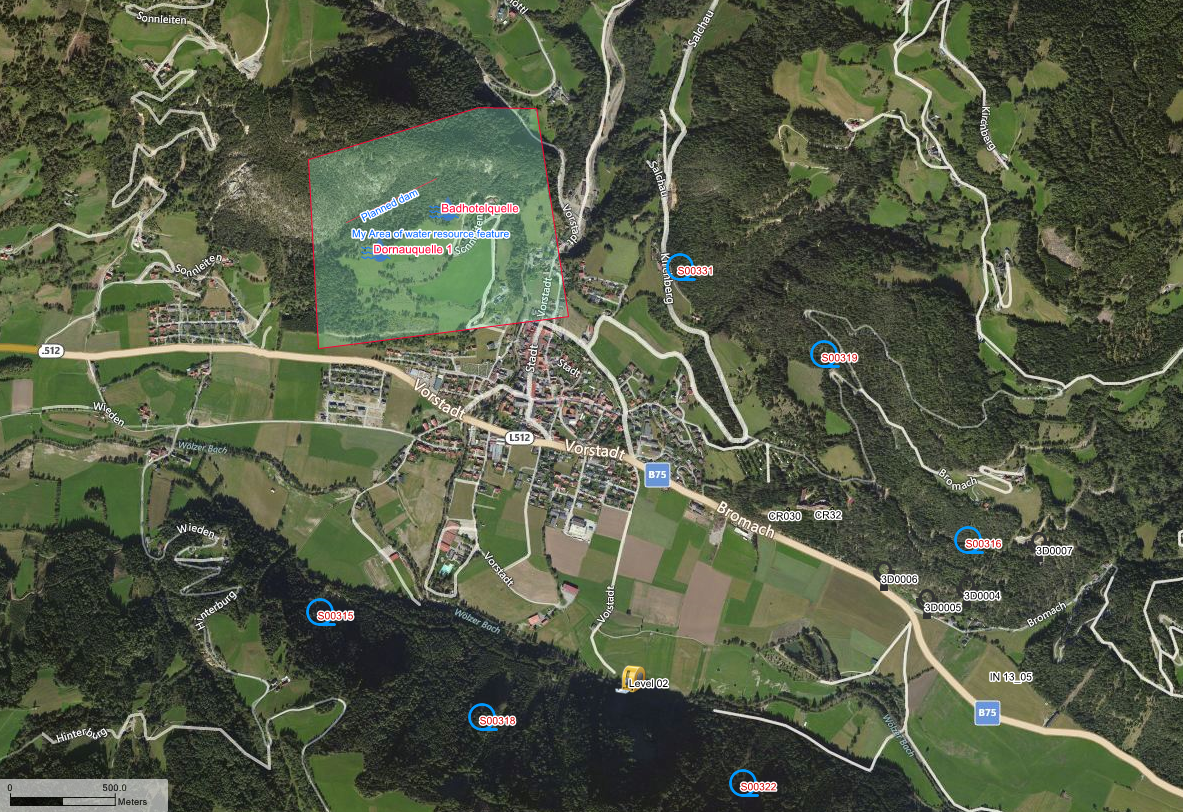
 maps showing different sensors in a flooding area")