Hightlight of Redbex that describes our data presentations, like charts, maps, etc.
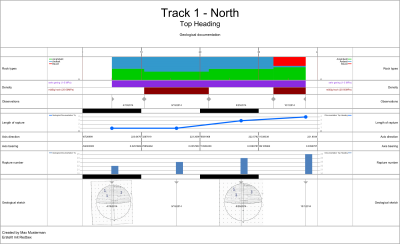
Axis section drawings
Easily display data along a given axis e.g. railway line, tunnel, street etc. and save hours of work with Redbex' axis section drawings.
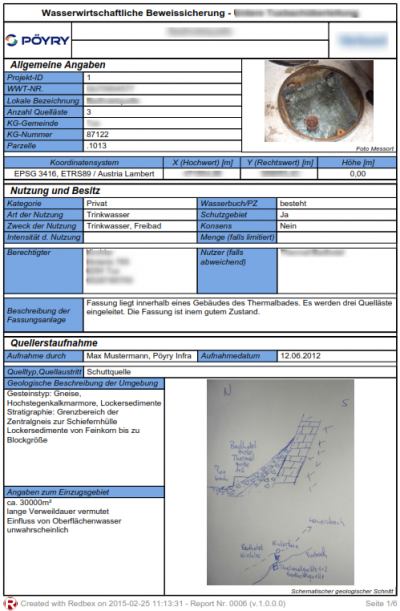
Reporting
Forget about routine paperwork. Let Redbex prepare reports for you. Automatically.
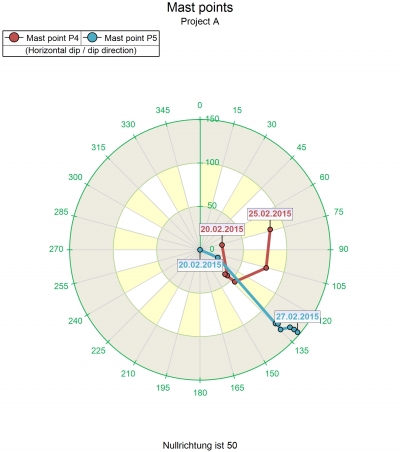
Limitless charting possibilities
Redbex comes with many different charts which allow to represent, analyse and compare any sensor data graphically.
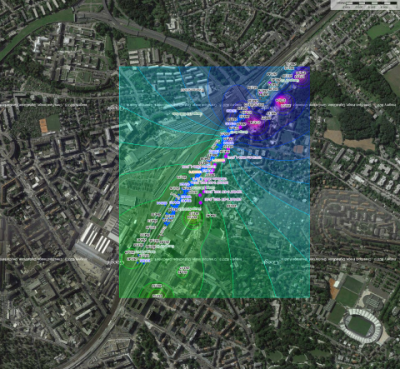
Present data on maps
Redbex includes its own GIS engine that allows you to present and edit all your data on maps.