Especially for features where each observation is made at a different location the Map View layer type Observation Property as Value – Midpoint is a very good way of displaying not only where an observation was made but at the same time also show the value of a selected property of the observation as text together with an optional color coding and sizing according to the value.
While this layer will always show the observations as a simple point (using the midpoint of the actual geometry of the observation) that midpoint can be sized according to the observation value and can also be colored according to the value.
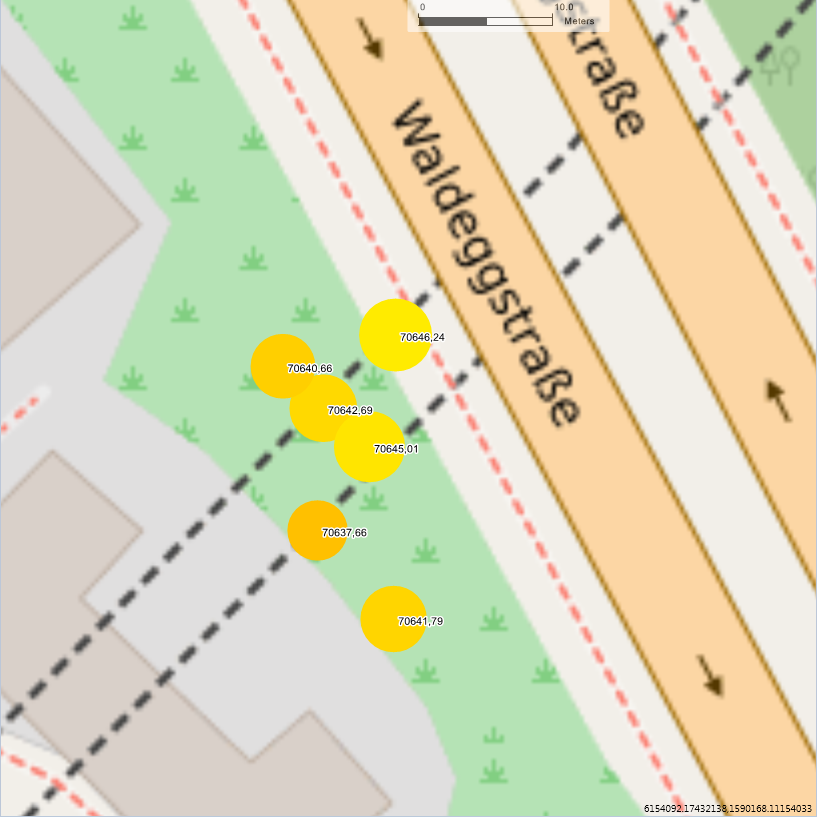
Map view Observation property Midpoint layer
Detailed information about this layer type can be found in the reference manual
How to setup the “Observation property – Midpoint layer”
In the list of layers select the newly added layer to see its properties (on the right side of the map view window)
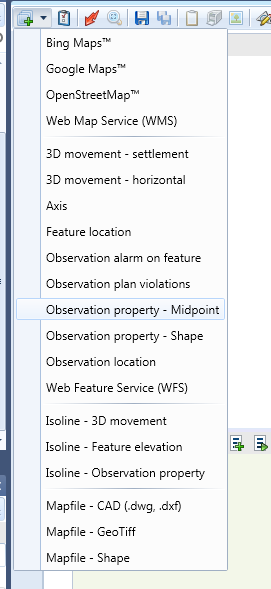
Adding a Map view observation property midpoint layer
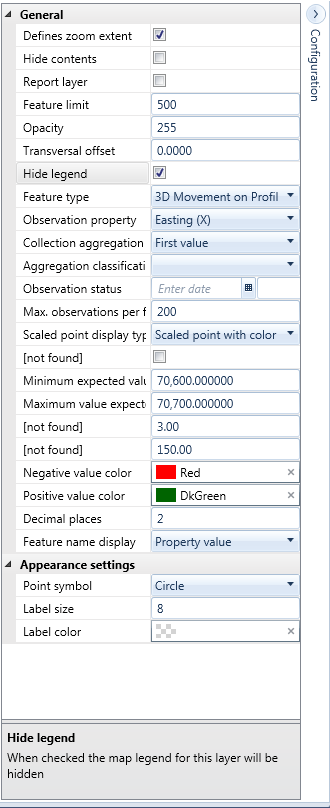
Observation property midpoint configuration settings
For details on the settings please refer to the RedBex reference manual.
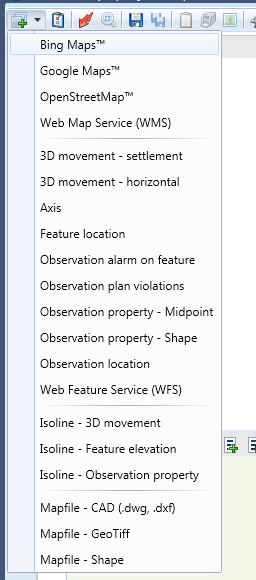
Adding a bing map layer
Execute a map view
After execution map view is updated and the requested features and observations are shown on the screen.
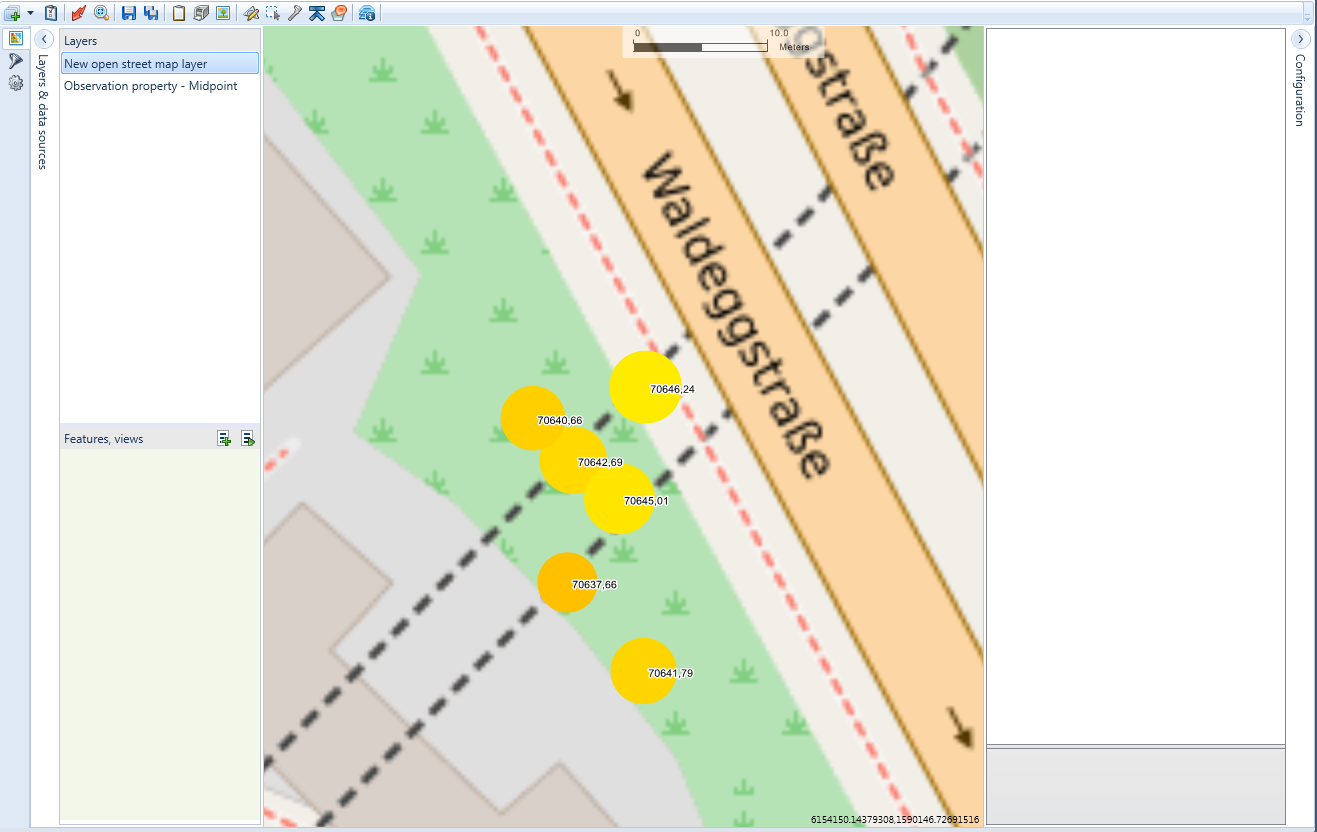
Map view after execution
If you get the expected result continue to the next section, else modify configurations or add or remove features.
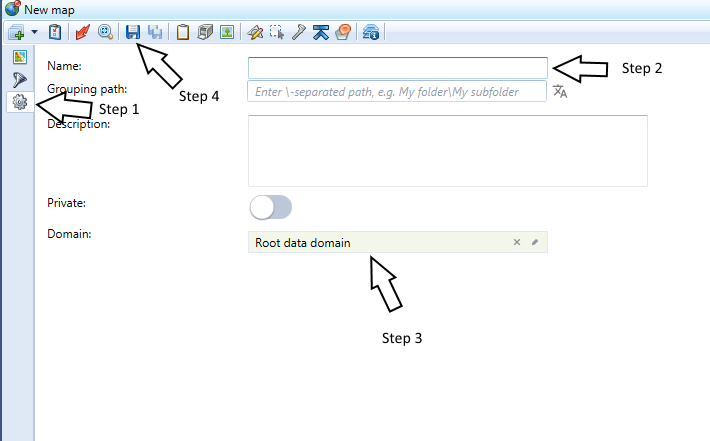
Saving a map view template steps
The steps to save a map view as template are:
- Click on the “Gear” for more settings.
- Enter a speaking name for the template and “Grouping path” text when you want the stored templates to appear in a folder in Data domain context tree.
- Drag and drop a Data domain in which the template will be stored. Please keep in mind the data propagation. For more information on this please refer to Presentation templates.
- Click the save button